Debugging Malloc Lab for CSAPP
These days I’m working on malloc lab for course csapp. No doubt that it’s the hardest lab in this course. Everyone feels desprate when facing endless segmentfault. Typically, you just added a few lines and then your malloc became full of segment faults.

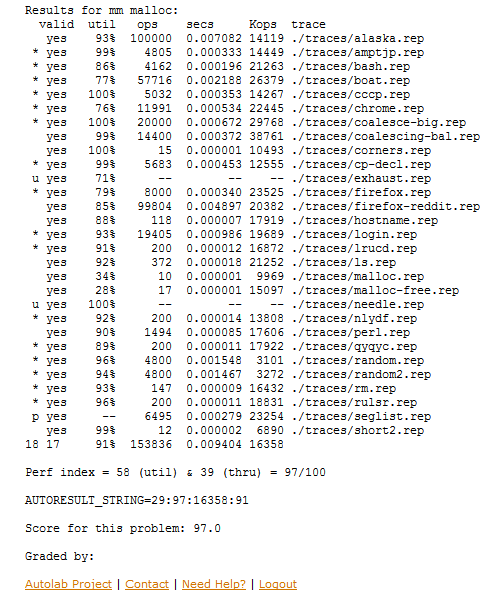
I spent over 40 hours on this lab and 70% of my time is on debugging. I also implemented many optimizations to improve my malloc’s performance. But finally my score is stuck at 97. Only 1 guy in this class got 100. I have no idea how he made this. It is said that he removed header and footer of block. If you don’t want to spend too much time on this lab, writing a malloc with explicit list is enough to get 90+ score. This is definitely possible and has been proved by my friend and TA.
In this article, I’ll talk about some useful techniques to debug your malloc. Rather than understanding how virtual memory works, it’s more important to learn how to debug in this lab. Without GDB, it would be impossible to finish.
Firstly, let’s focus on some points you should take care to avoid unnecessary debugging.
1.Reset your global variables in mm_init
The grader program mdrive will continuously call your malloc in one trace several times. Once a trace is finished, the program will start over. In other words, the heap will be reinitialized many times in one run. As the heap is initialized by your mm_init function, you should reset your global variables everytime mm_init is called. Otherwise, the value of global variable will be unintentionally inheritted. This may result in some unwanted bugs.
2.Use macro carefully
As tons of macros are defined in this lab, sometimes you may get confused whether your macro is used properly. A very typical mistake I had made many times is like this:
GET_SIZE(NEXT_BLKP(bp));
Noticing that this line tried to get block size of block bp’s next block. Mostly there will be lots of nested macros, it is hard to remember everything when writing. So for this case, size information is only stored in header of blocks (or footer, if you used), this parameter pointer should be pointer points to header of block. The correct version of previous line is:
GET_SIZE(HDRP(NEXT_BLKP(bp)));
This mistake will give you wrong size infomation (mostly return size 0), and it’s hard to debug in GDB. But it would be a lot easier to be found by your own mm_checkheap function.
3.Use inline function instead of macro
One advantage of inline function is that it has type-checking while macro don’t. So when you are using macro to do some conversion stuff, for example, convert a pointer into an unsigned integer, it’s better to use inline function instead.
4.Write mm_checkheap simultaneously
You must also heard professor saying “Do write your heap checker!” many times. It is also repeated by TA again and again. And now I’m still telling you this. Because it’s REALLY helpful. Although GDB is powerful, it cannot find your design problem. However, mm_checkheap function checks all possible potential design problems such as pointer consistency, epilogue block corruption. It is super useful in following debugging!
The best time you start writing your mm_checkheap function is when you finished your mm_init. Then call mm_checkheap after heap is initialized. At this point, your initialized heap should be stable and bug-free. Otherwise your following work would be hard.
Now let me introduce some techniques I found useful in debugging this lab.
1.Tune your compilation flags.
When writing my malloc, it’s common to compile and test. So I made some modification to my makefile.
CFLAGS = -Wall -Wextra -g -ggdb3 -DDRIVER -std=gnu99
Firstly I removed -Werror and -O2 as most of you did.
Then I added flag -ggdb3. This flag is quite useful since it allows you to call macros directly in GDB. You can expand macro in GDB too. Calling a macro is the same as calling function in GDB:
(gdb) call GET_SIZE(HDRP(bp))
2.Use assert
Sometimes it costs too much to call mm_checkheap or it’s not suitable to call it because you are in half way of some operation, it would be right time to use assert. “assert” is a predefined macro in “assert.h” in C standard library. For performance issue I redefine assert as below:
#ifdefine DEBUG
# define dbg_assert(...) assert(__VA_ARGS__)
#else
# define dbg_assert(...)
#endif
Mostly, I use assert as a precondition to make sure no unwanted problem happens:
if (asize <= GET_SIZE(HDRP(bp)) {
    dbg_assert(GET_ALLOC(HDRP(bp)) == 0);
    return bp;
}
In this case, before pointer bp is returned, the status of block bp is checked by assert. If predefined condition is not true, program stops and outputs related information. It acts like a run-time error check.
3.Load .gdbinit file to avoid repeating work
Sometimes you made tiny modification to your malloc and need to rerun GDB, all breakpoints should be same. If you manually set all these breakpoints again and again, it’s not only time-wasting but also tiresome.
Creat a newfile named “.gdbinit” in your work directory, the content should be gdb commands you mostly used when debugging. Here’s my .gdbinit file as an example:
b mm_init
b mm.c:245
watch heap_lastp
In this file, I set breakpoints at funtion mm_init and line 245 at source file mm.c. I also set watchpoint to global varible heap_lastp. So when you open your GDB in the same directory where .gdbinit file exists, it will execute commands in .gdbinit file automatically. For CMU students, it’s not allowed load .gdbinit file directly on shark machine for secure reason. But GDB will give you guidance on how to load. It’s simple, just follow it.
4.Condition breakpoints
The basic format of condition breakpoint is:
breakpoint WHERE if CONDITION
This technique is very useful when you found a segment fault and in what condition it happens by “backtrace” command. For example, you found a segment fault in trace bash.rep when function “free” takes parameter “bp=0x800000038”. By setting breakpoints free, you have to type “continue” command many times until “free” takes right parameter. But with condition breakpoints, you can set breakpoint like below:
b free if bp==0x800000038
So this time, program hits breakpoint only if bp==0x800000038. You can use whatever condition you want, it’s super convenient.
5.Set alias
The basic format of setting alias is;
alias [-a] [--] ALIAS = COMMAND
The ‘-a’ option specifies that the new alias is an abbreviation of the command. Abbreviations are not shown in command lists displayed by the ‘help’ command.
The ‘–’ option specifies the end of options, and is useful when ALIAS begins with a dash.
It’s common to call your mm_checkheap many times when debugging. Obviously, it’s not very convenient to type “call mm_checkheap(1)” repeatly. By typing following line:
alias cmc = call mm_checkheap(1)
You can call mm_checkheap(1) with only three character “cmc”. Unfortunately, the GDB installed on CMU shark machine do not support this feature. A later version should be fine.
6.Valgrind
Valgrind is an instrumentation framework for building dynamic analysis tools. In short, a bunch of tools. And the default tool used by command “valgrind” is a memory error detector. The usage is simple:
valgrind ./mdriver
Then you got output about your malloc program memory error. If there is a segment fault, it will tell you which line the segment fault happens. You can find more information about Valgrind on its homepage.
Have your malloc program well-designed before implementing. Debugging and optimizating it is painful.